Creating data-driven Infographics and Reports for the NAO
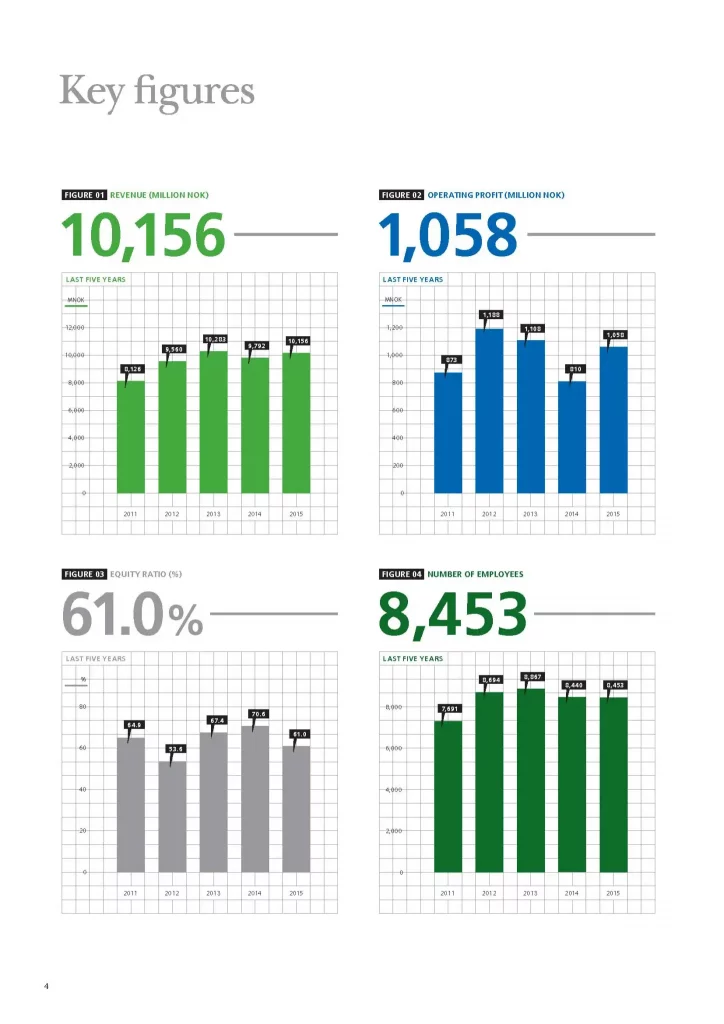
At the National Audit Office, I specialise in transforming intricate data into clear, trustworthy visuals. I craft stories from numbers and design systems that carry those stories across reports, infographics, motion, and interactive content.
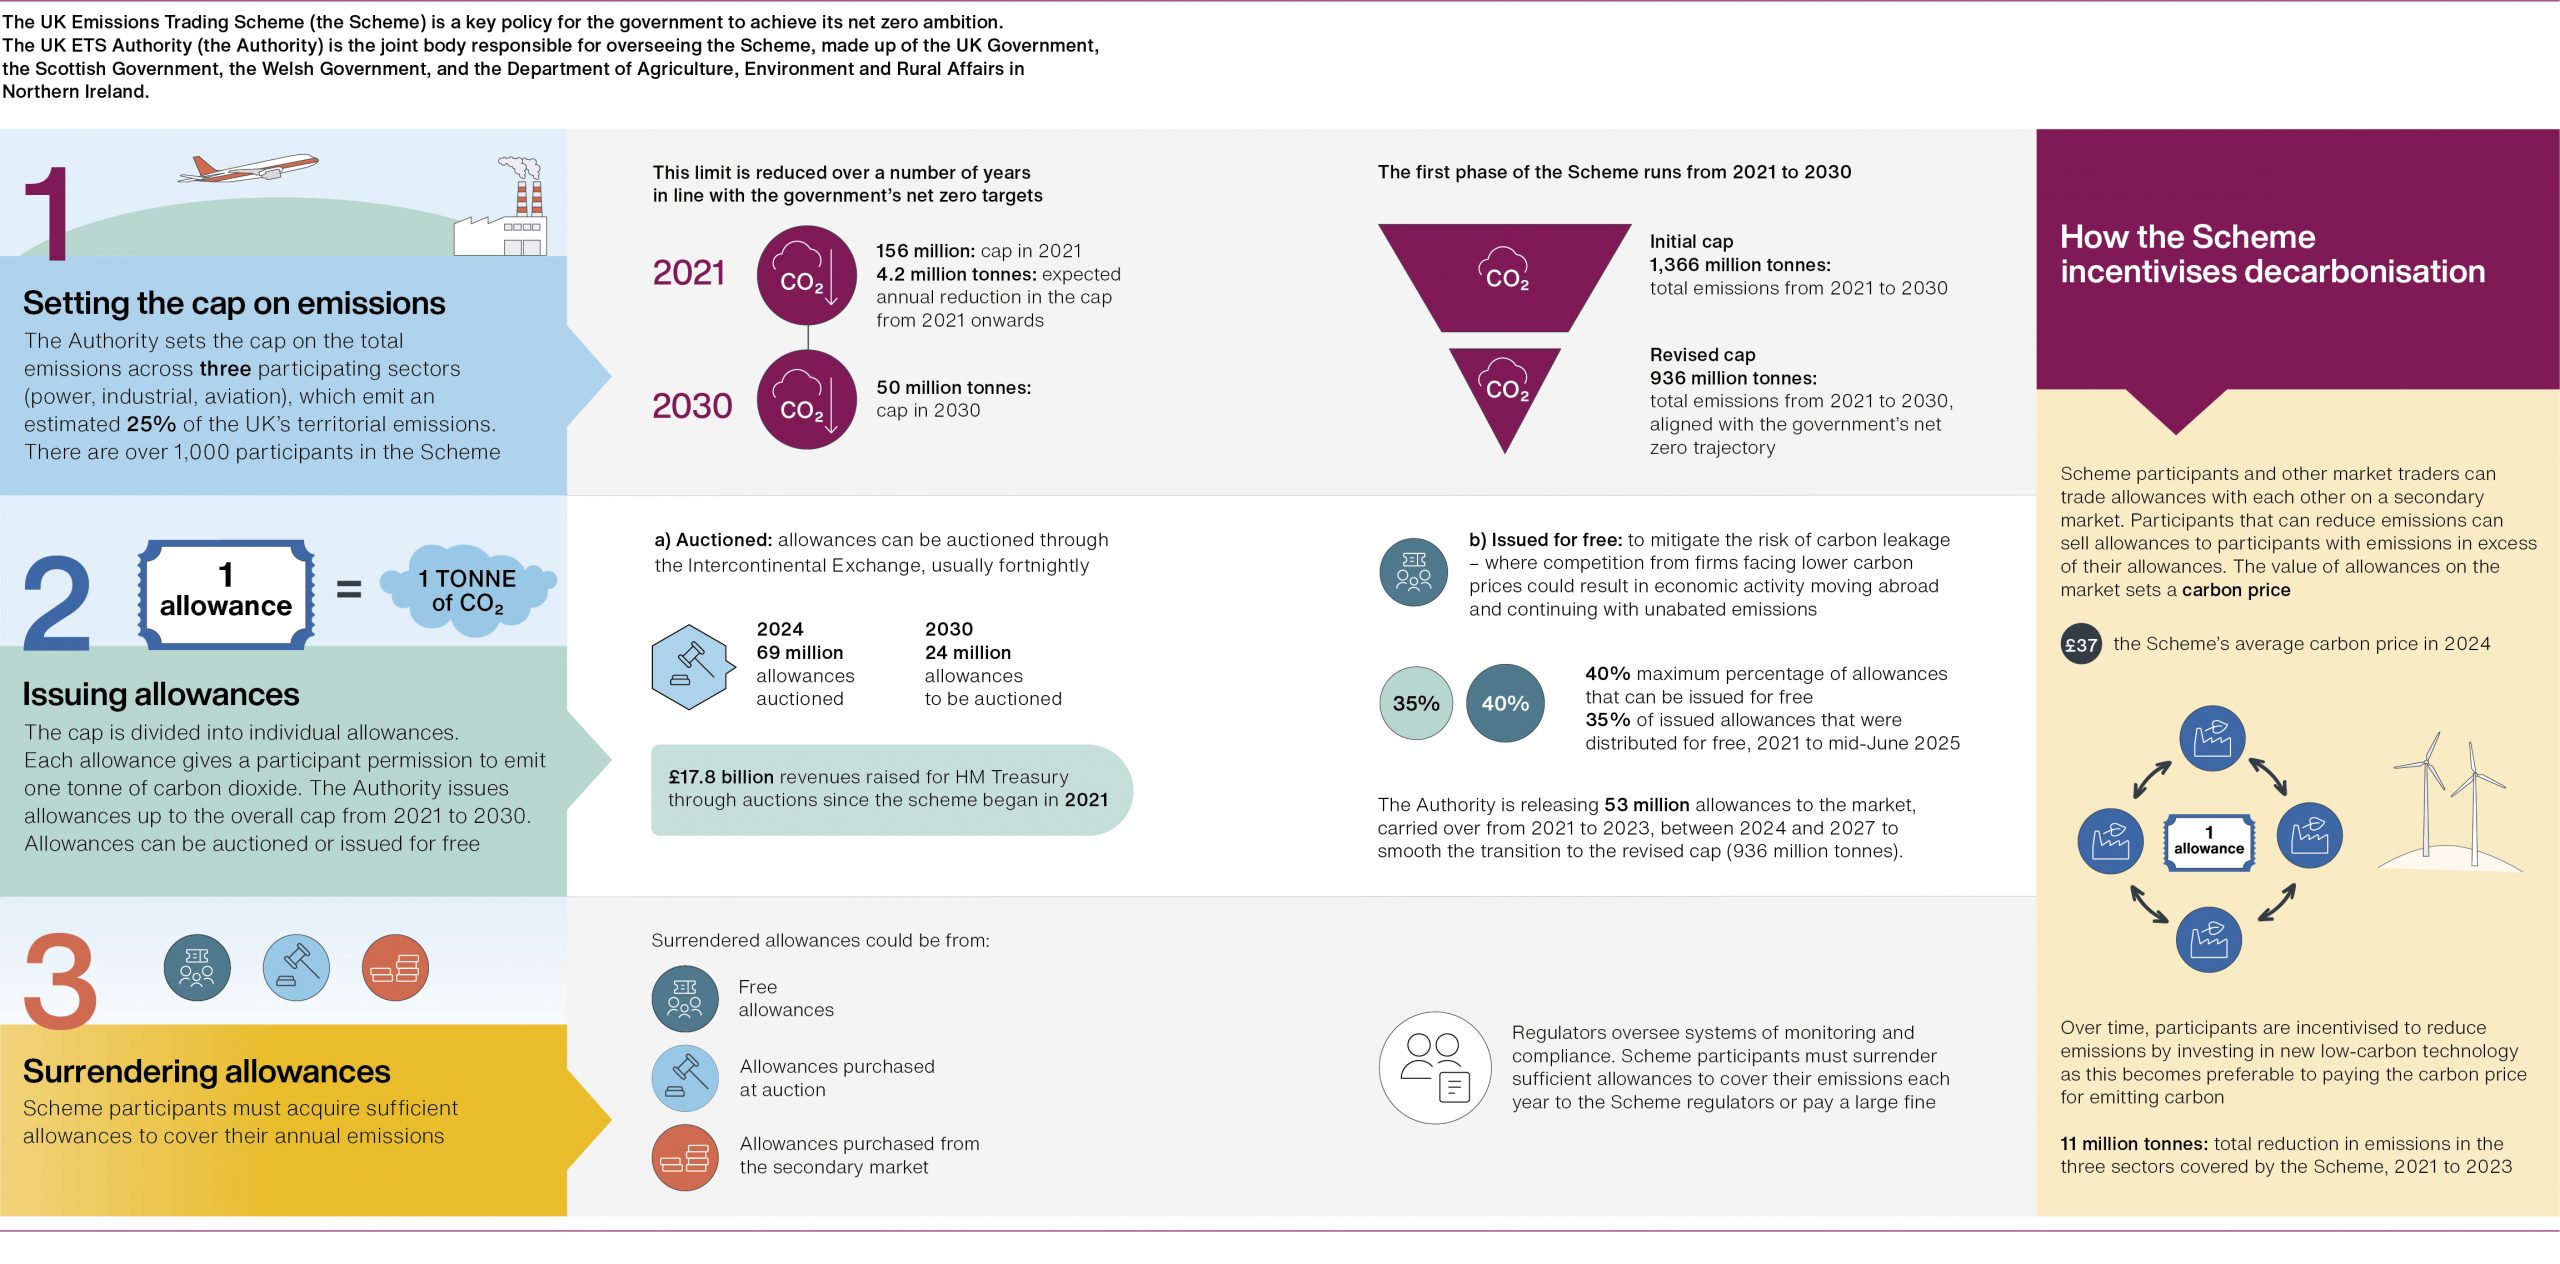
Featured in the UK Emissions Trading Scheme report, my work highlights my ability to turn complex data into a visually compelling and easy-to-understand infographic. See the full report here.
Creating Environmental Impact through DNV Global’s Oil and Gas Projects
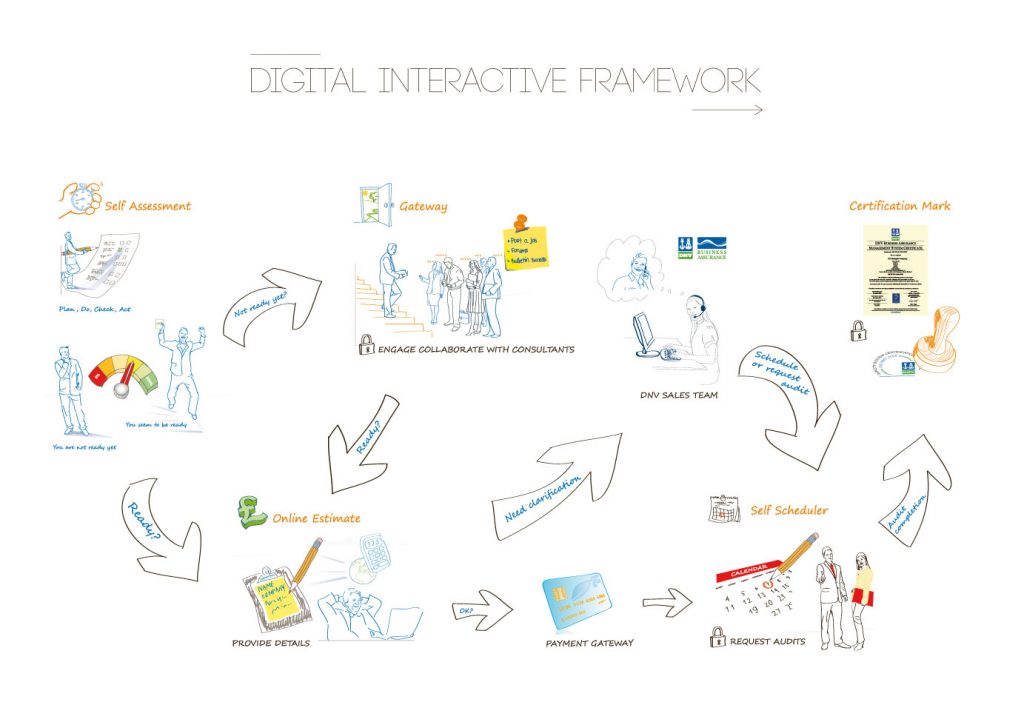
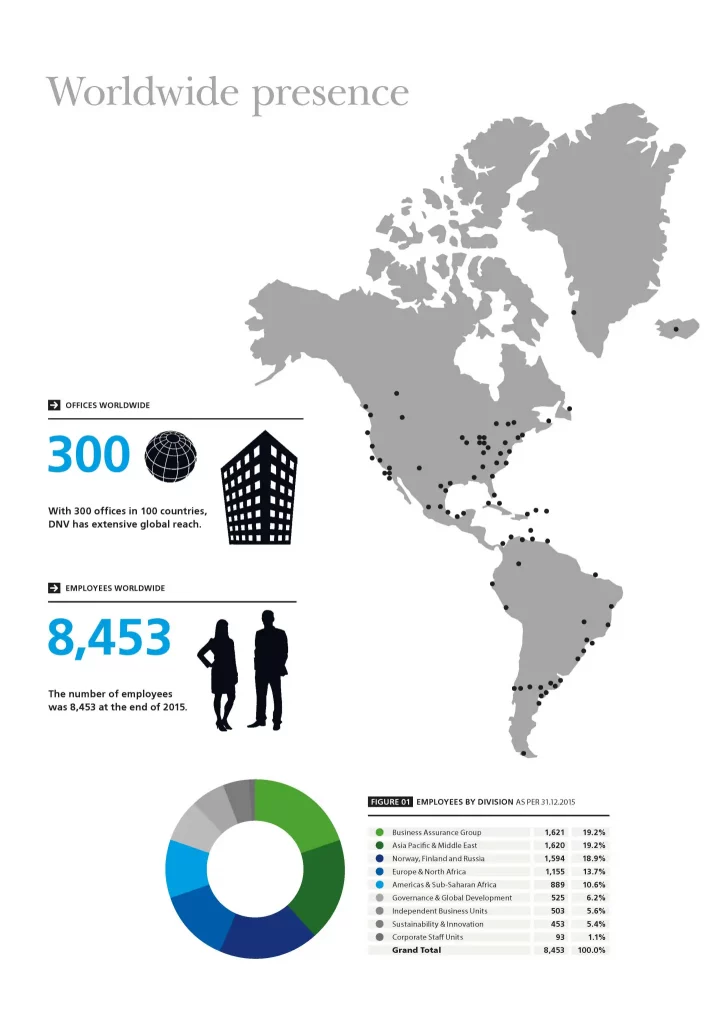
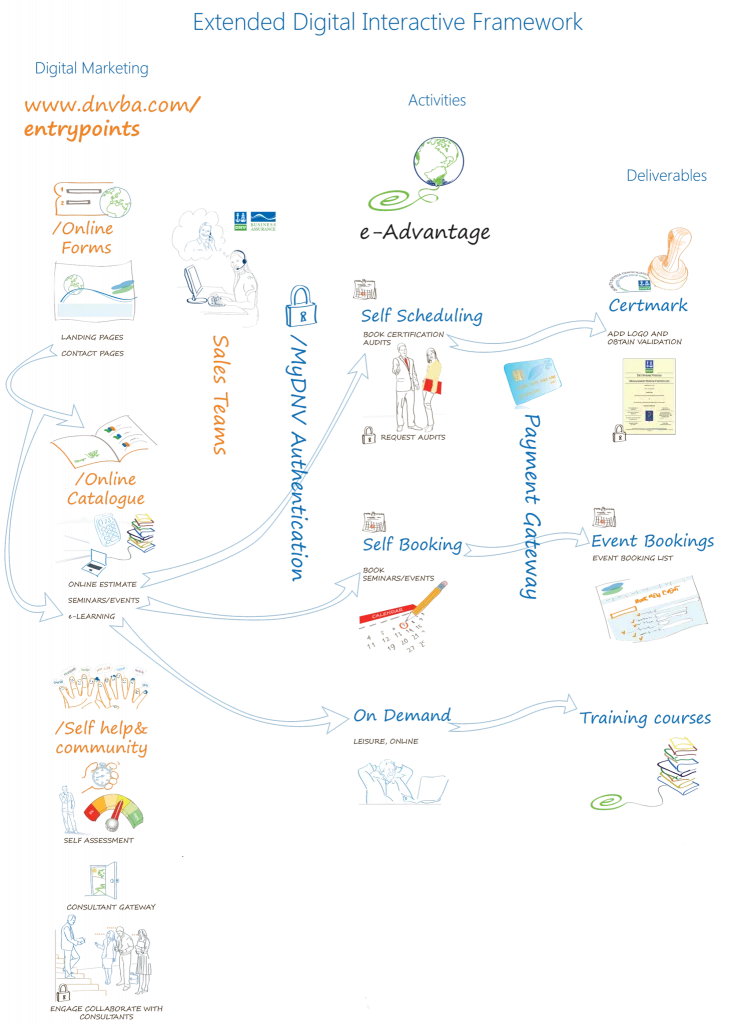
Designing user journeys for DNV Global. I crafted digital experiences that transform complex, technical information into clear and engaging stories. Through interactive frameworks and dynamic maps, I helped users navigate heavy content with ease and purpose.
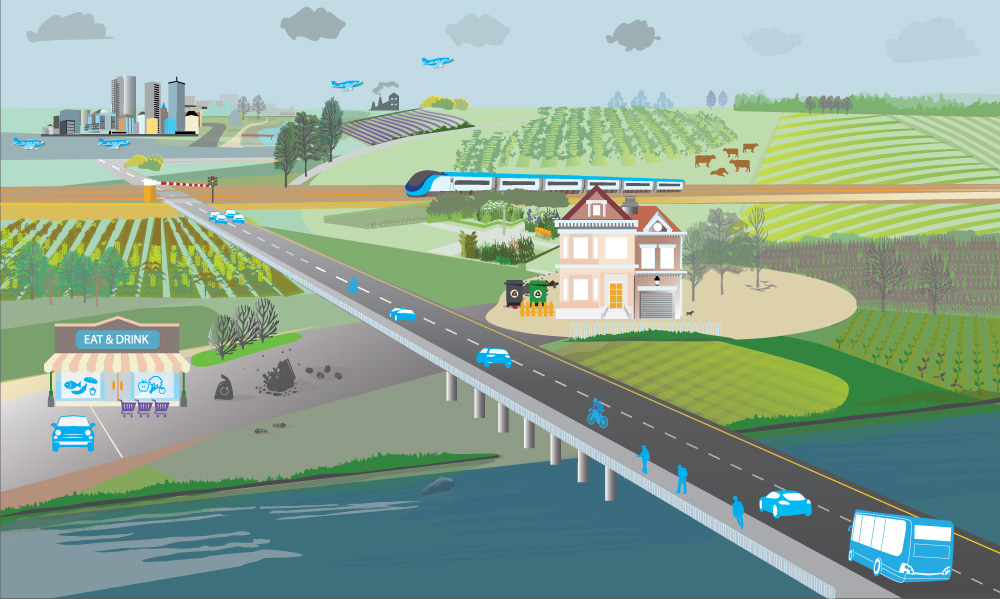
Alongside this, I created bespoke illustrations that brought abstract ideas to life, turning intricate briefs into visual narratives that resonate and inspire.

